Viewing the experiment dashboard
The experimentation dashboard provides clear summaries, visualisations, and detailed data to help you easily navigate your experiments.
How to Access Your Experiment Dashboard
There are two ways to view your experiment results:
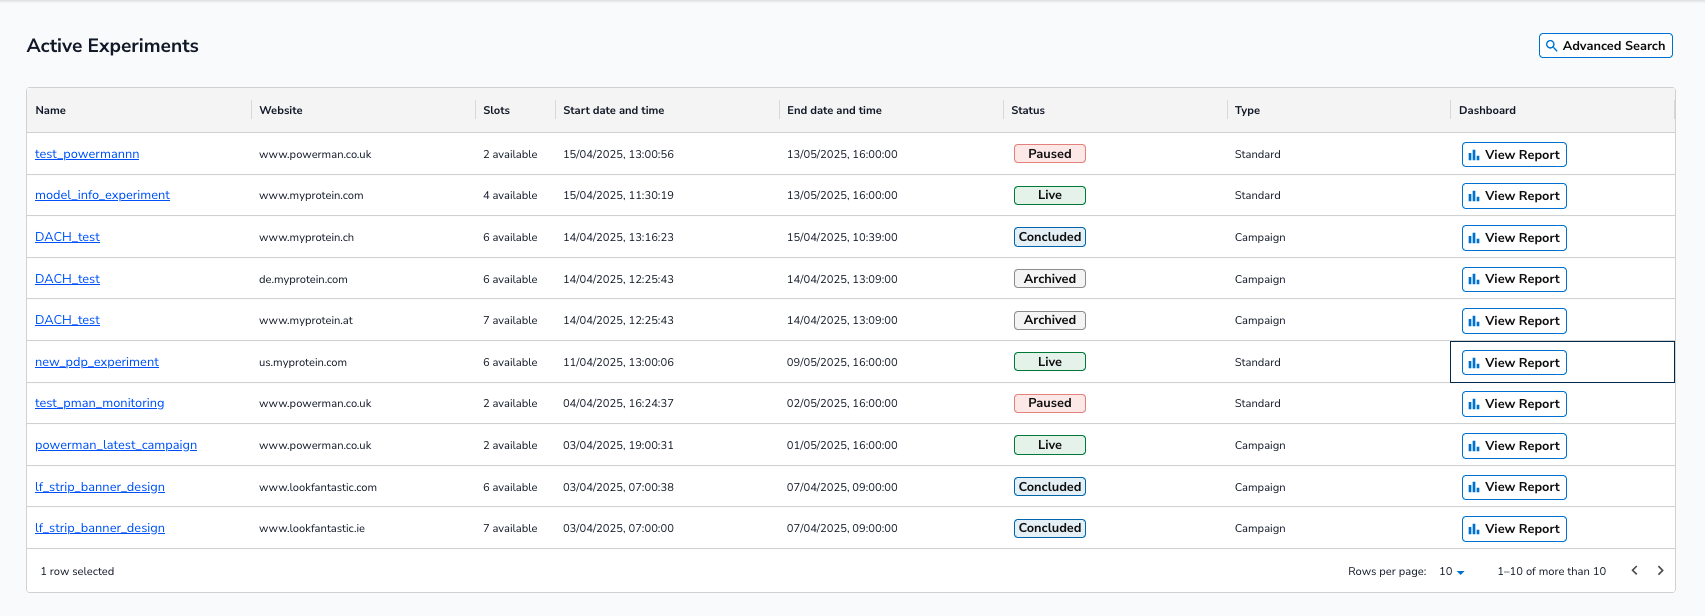
Option 1 – From the Manage Tab
- On the home page, navigate to the Manage tab.
- Locate the row for the experiment you want to view.
- Click View Report on that row.
Option 2 – From the Experiment Details Page
- Click the experiment name from the list to open its details page.
- In the top right corner of the details page, click View Report.
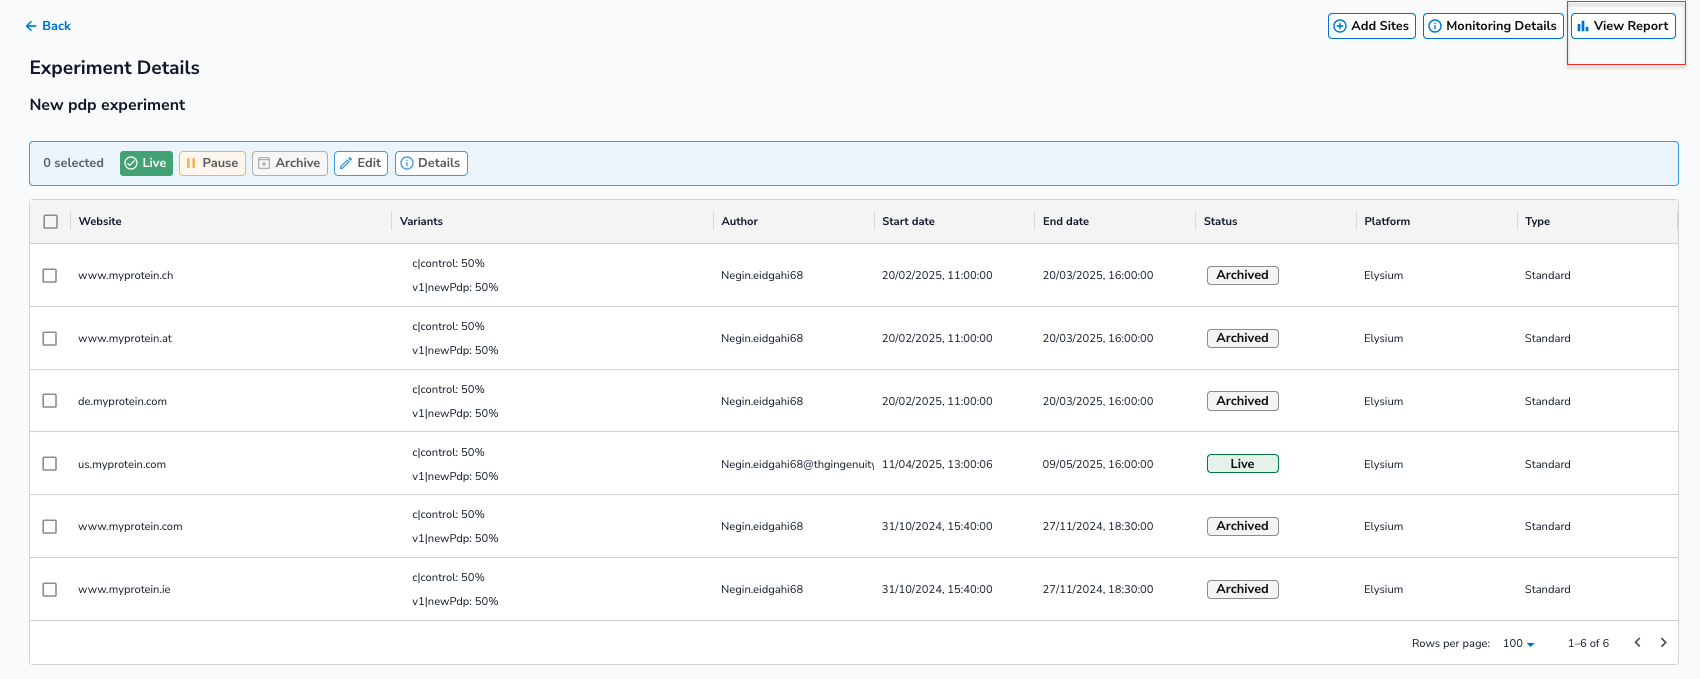
Once you click View Report, you’ll be taken to the experiment dashboard where you can explore results, graphs, and tables
Data Summaries
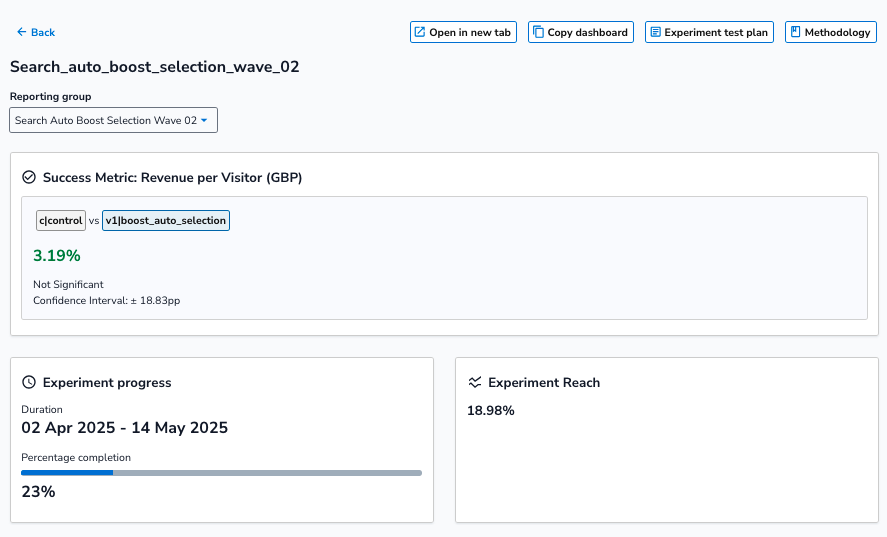
The summary section provides a snapshot of your experiment’s key details
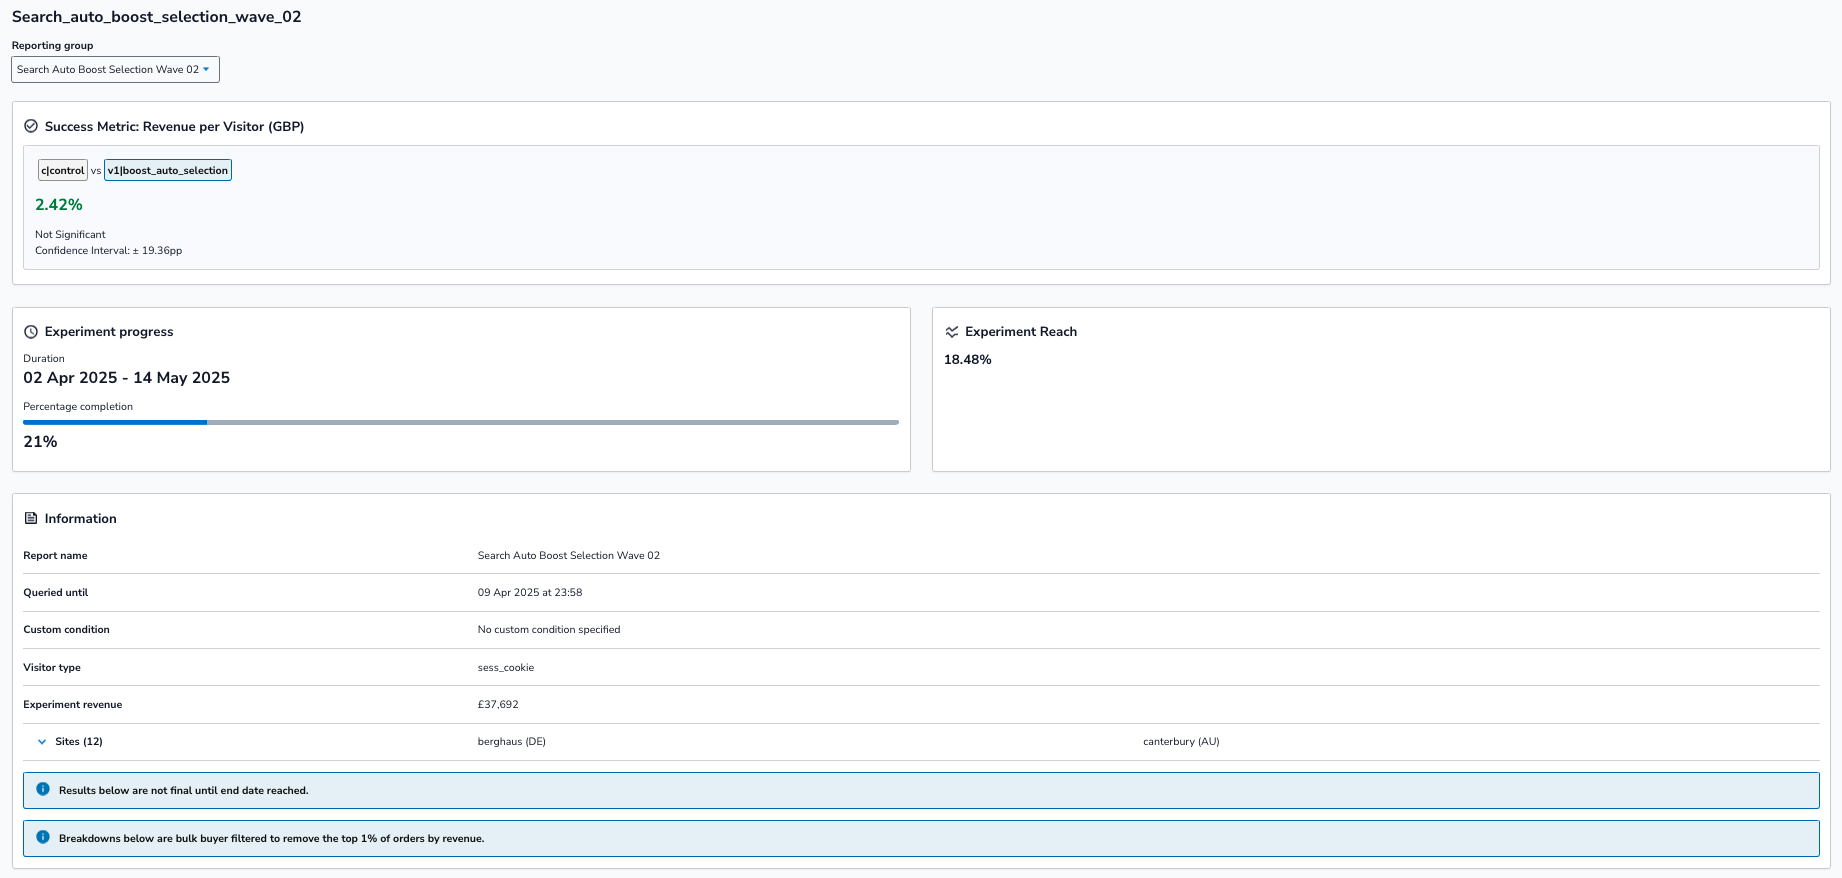
Success metric, experiment progress and reach
-
Success Metric: Typically, the success metric is Revenue per Visitor (RPV), but for checkout experiments, the metric used is Conversion Rate. Each variant is compared directly against the control (e.g., Control vs. Variant 1, Control vs. Variant 2). For each comparison, you will see:
- Percentage uplift or decrease (in green or red).
- Statistical significance (e.g., Significant or Not Significant).
- Confidence intervals to understand the reliability of the results.
-
Experiment Progress:
- Clearly indicates experiment duration (start and end dates).
- Percentage completion to show current progress.
-
Experiment Reach:
- Percentage of total visitors involved in the experiment.
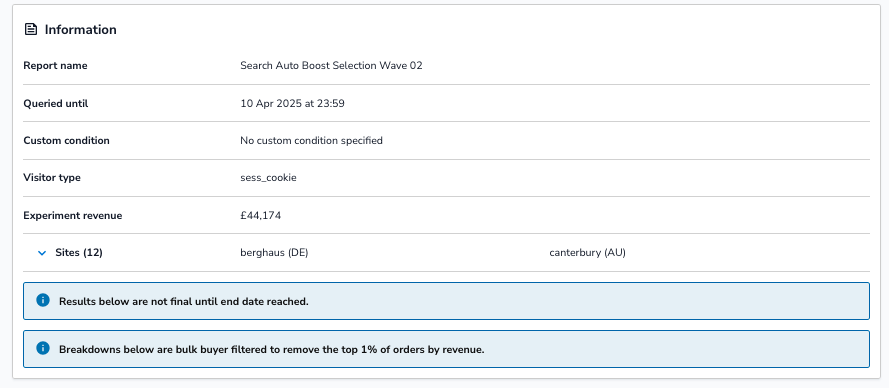
- Information Panel:
- Report name: Identifies the specific experiment.
- Queried until: Indicates the date and time the displayed data is valid up to.
- Custom condition: Lists any specific filters applied to the experiment data.
- Visitor type: Indicates the tracking method used (e.g. session cookie).
- Experiment revenue: Total revenue generated by visitors in the experiment.
- Sites involved: Lists all sites or regions included in the experiment.
Additional notes may indicate special conditions or filters applied to your data, such as excluding bulk buyers or that results aren’t final until the experiment concludes.
Revenue Extrapolation
This section estimates the potential annual impact of each variant if it were rolled out site-wide.
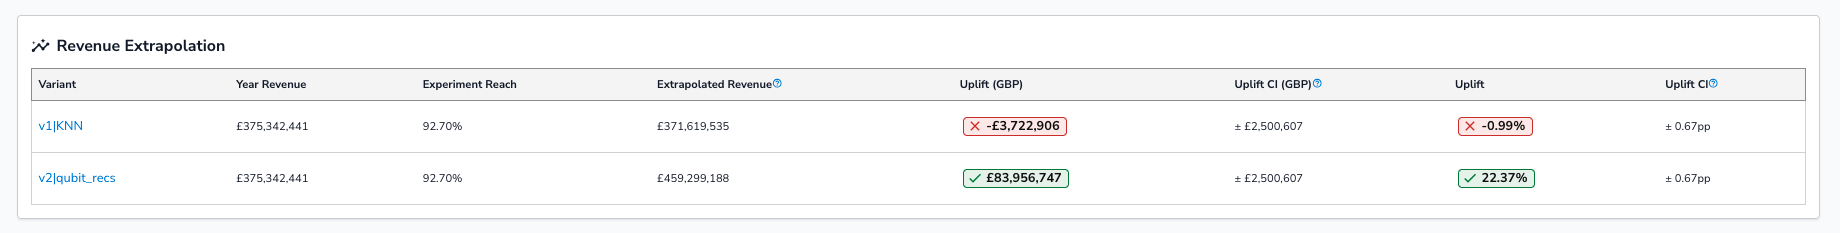
- When it’s shown: Only displayed when an experiment has ended and the uplift in the success metric is statistically significant.
- Metrics displayed:
- Year Revenue: Baseline annual revenue.
- Extrapolated Revenue: Estimated annual revenue if the variant were live.
- Uplift (GBP): Projected revenue gain or loss.
- Confidence Intervals (CI): Range of uncertainty around the uplift estimates.
- Percentage Uplift: Relative increase or decrease in revenue.
This helps quantify the financial impact of each variant beyond the test period.
Graphs
Visualise your experiment’s performance using interactive graphs.
Note: Graphs display aggregate-level results only. Any breakdowns (e.g. by site or visitor type) are not reflected in the graph visualisations.
- Viewing Options:
- Switch graph types using the dropdown menu.
- Compare variant performance side-by-side by selecting different variant combinations.
- Adjust the layout for easy visual comparisons.
Cumulative Uplift
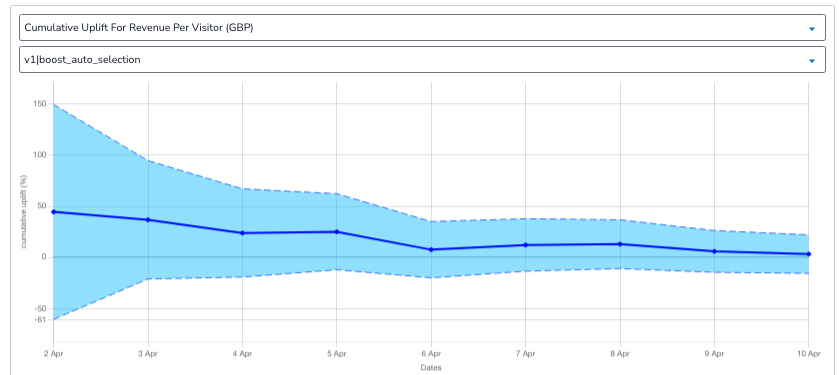
Shows cumulative performance over time.
Non-Cumulative Uplift
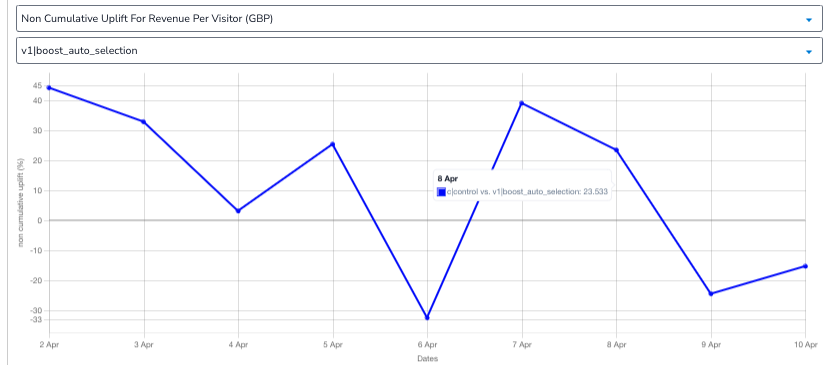
Daily uplift independent of past performance.
- Switch graph types using the dropdown menu.
- Compare variant performance side-by-side by selecting different variant combinations.
- Adjust the layout for easy visual comparisons.
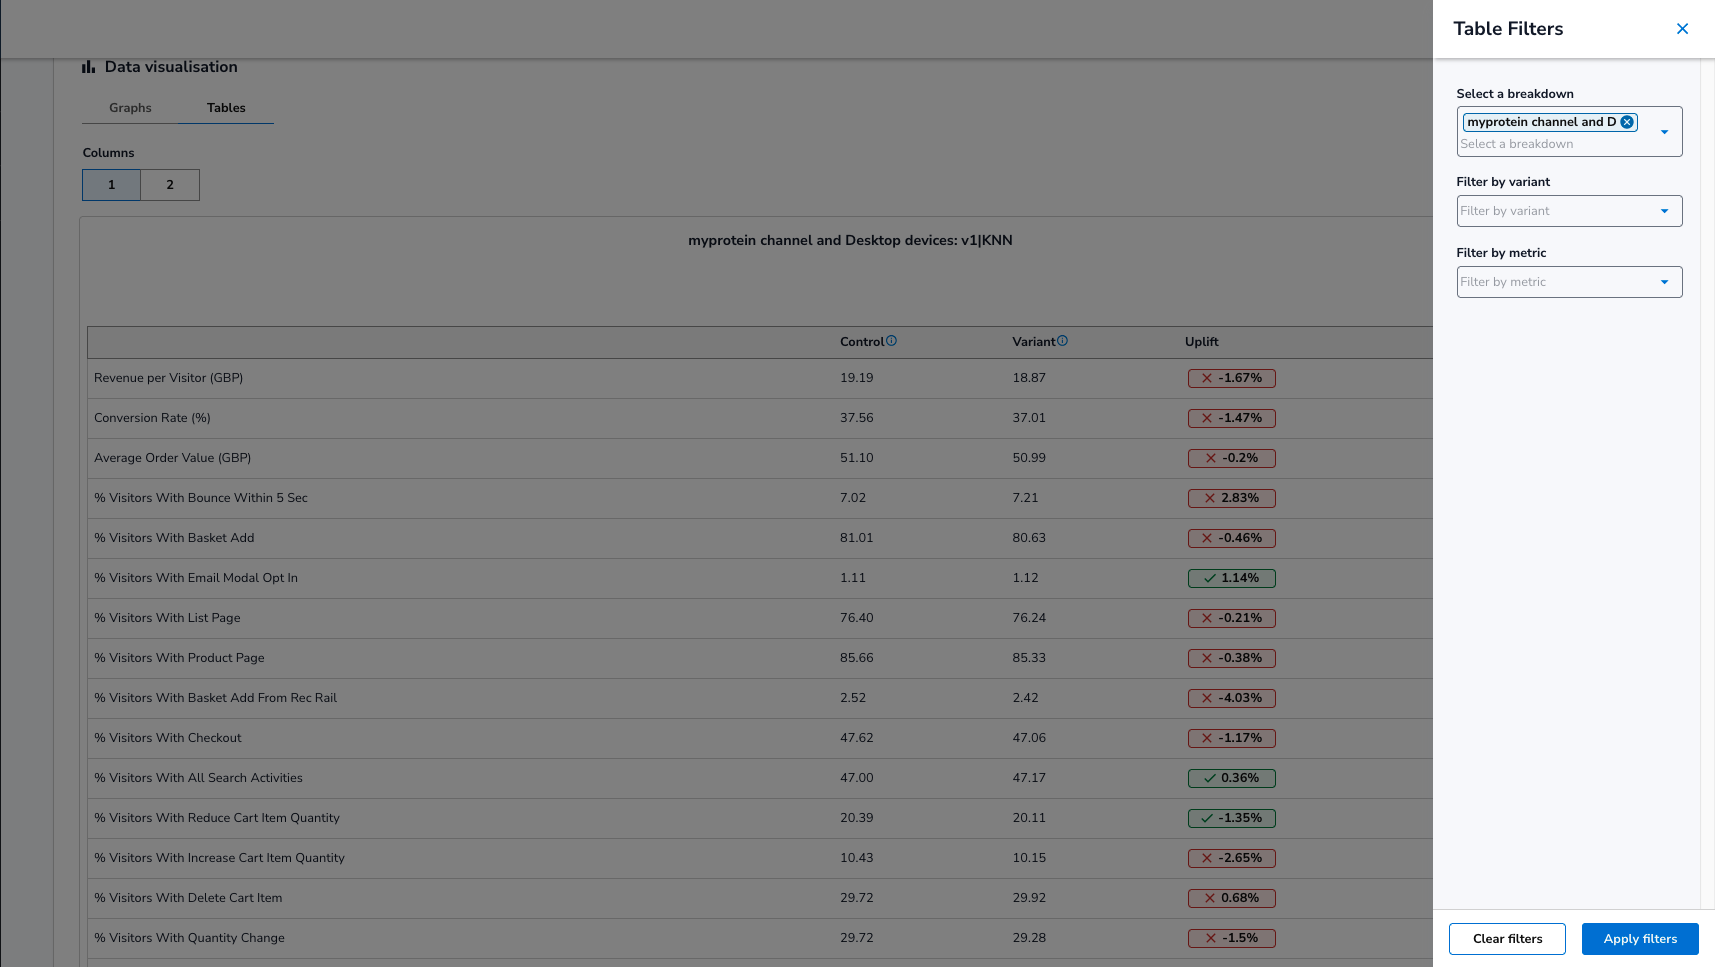
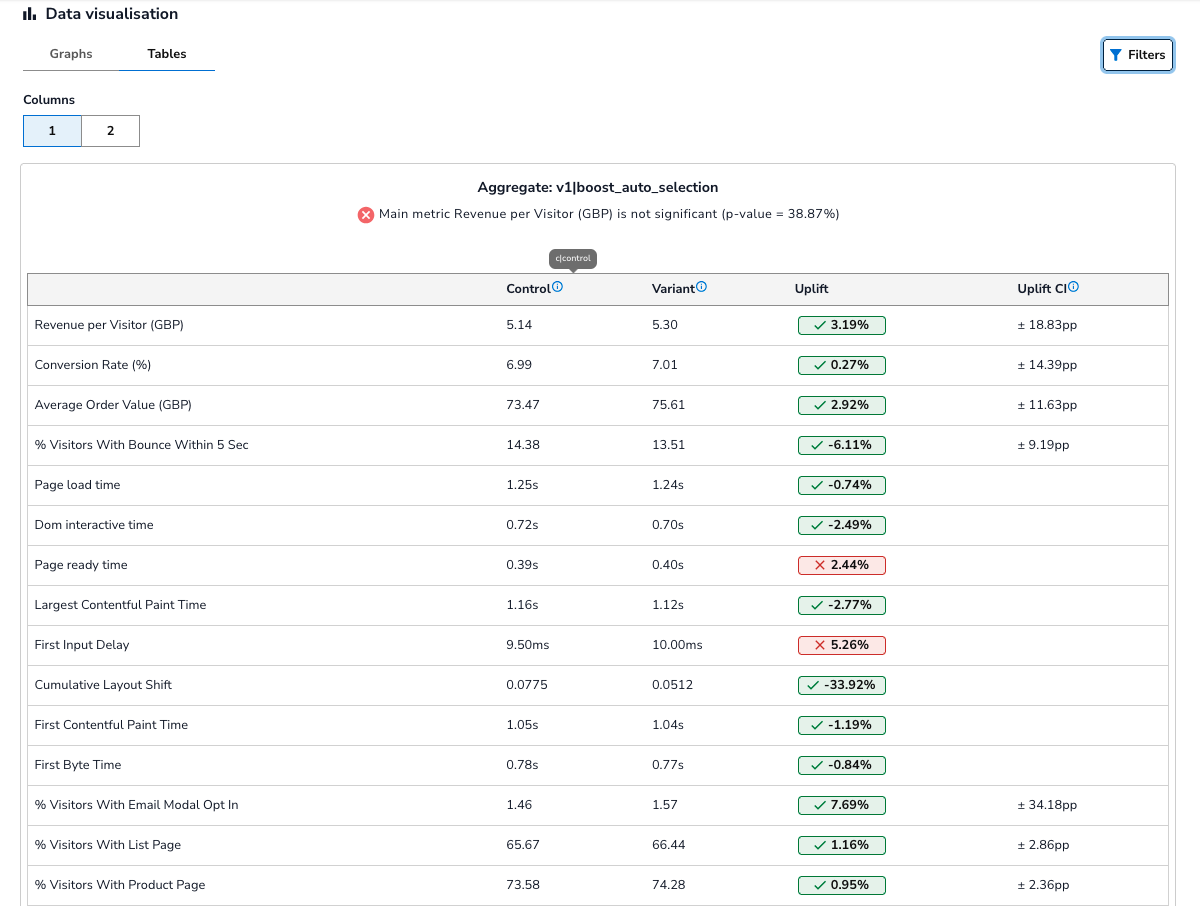
Tables
Detailed numeric views of your key metrics.
- Select and filter data by specific breakdowns, variants, or metrics.
- Compare tables side-by-side to easily review performance differences across variants.
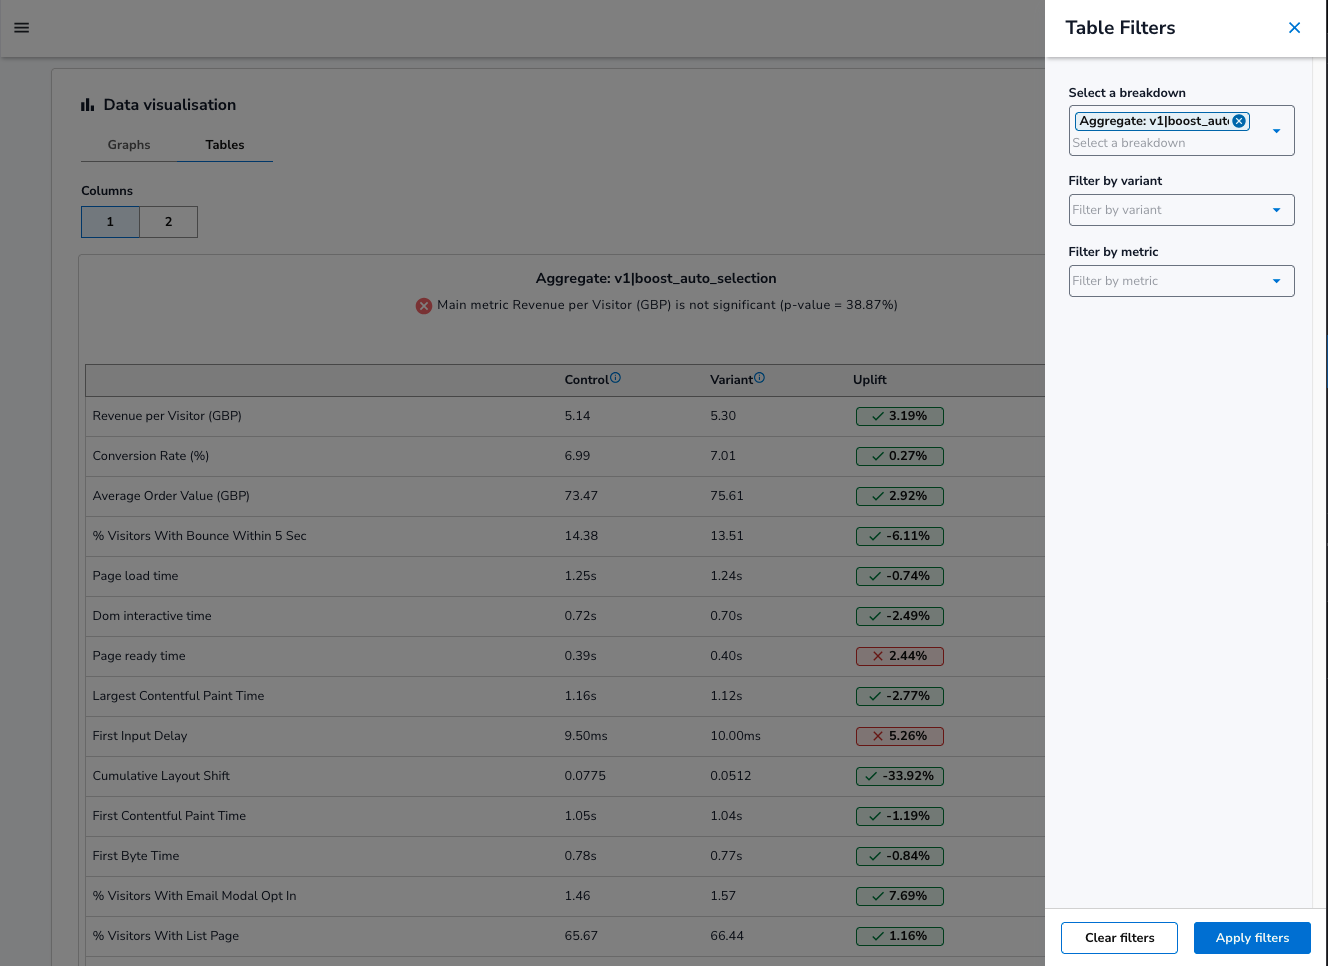
Filter Options (Dropdown)
You can use the dropdown menus to control what data is shown in the table view.
- Filter by a specific variant, metric, or breakdown.
- Apply multiple filters to customise the view.
Filter dropdown collapsed
Filter dropdown expanded
Filter applied example
In this view, a breakdown filter has been applied to focus on desktop devices and the Myprotein site. No variant or metric filters were selected, so the table displays all variants and all available metrics.